Economy of Uganda

Economy of Uganda
Kampala, the financial centre of Uganda
CurrencyUgandan shilling (USh)
1 July – 30 June
Trade organisations
AU, EAC, COMESA, WTO
Country group
Statistics
GDP
  • Increase $64.28 billion (nominal; 2025)
  • Increase $187.11 billion (PPP; 2025)
GDP rank
  • Increase 6.3% (2024)
  • Increase 6.1% (2025)
GDP per capita
  • Increase $1,340 (nominal; 2025)
  • Increase $3,900 (PPP; 2025)
GDP per capita rank
3.2% (2024)
GDP by sector
  • Agriculture: 71.9%
  • Industry: 4.4%
  • Services: 23.7%
  • (2017 est.)
3.2% (2019)
19.1% (31 December 2017 est.)
Population below national poverty line
  • 21.4% (2017 est.)
  • 41.7% on less than $1.90/day (2016)
42.8 medium (2016)
  • Decrease 0.525 low (2021) (166th)
  • Increase 0.396 low IHDI (2021)
Labour force
  • Increase 16,833,878 (2019)
  • 48.0% employment rate (2017)
Labour force by occupation
  • Agriculture: 71%
  • Industry: 7%
  • Services: 22%
  • (2013 est.)
90% (2021)
Main industries
Sugar processing, brewing, tobacco, cotton textiles, cement, steel production
External
ExportsIncrease $3.339 billion (2017 est.)
Export goods
coffee, fish and fish products, tea, cotton, flowers, horticultural products, gold
Main export partners
ImportsIncrease $5.036 billion (2017 est.)
Import goods
Capital equipment, vehicles, petroleum, medical supplies, cereals
Main import partners
FDI stock
$10.909 billion (2016)
Decrease −$1.212 billion (2017 est.)
$7.163 billion (31 December 2017 est.)
Public finance
$25.3 billion ($11.7 billion, domestic) (2023)
Increase $3.654 billion (31 December 2017 est.)
–4.1% (of GDP) (2017 est.)
$3.98 billion (2017)
$7.66 billion (2017)
Economic aid$3.68 billion (2017)
Standard & Poor's: Decrease B
All values, unless otherwise stated, are in US dollars.
A family in a market in Kampala

Uganda is a low-income country with excellent potential for growth. It is endowed with significant natural resources, including ample fertile land, regular rainfall, and mineral deposits.

Chronic political instability and erratic economic management since the implementation of self-rule has produced a record of persistent economic decline that has left Uganda among of the world's poorest and least-developed countries. The national energy needs have historically exceeded the domestic energy generation, though large petroleum reserves have been found in the western region of the country.

After the turmoil of the Amin period, the country began a program of economic recovery in 1981 that received considerable foreign assistance. From mid-1984 onward, overly expansionist fiscal and monetary policies and the renewed outbreak of civil strife led to a setback in economic performance.

The economy has grown since the 1990s; real gross domestic product (GDP) grew at an average of 6.7% annually during the period 1990–2015, whereas real GDP per capita grew at 3.3% per annum during the same period. During this period, the Ugandan economy experienced economic transformation: the share of agriculture value added in GDP declined from 56% in 1990 to 24% in 2015; the share of industry grew from 11% to 20% (with manufacturing increasing at a slower pace, from 6% to 9% of GDP); and the share of services went from 32% to 55%.

Currency

Uganda began issuing its own currency in 1966 through the Bank of Uganda.

Agriculture

Agricultural products supply a significant portion of Uganda's foreign exchange earnings, with coffee alone, of which Uganda is Africa's second largest producer after Ethiopia, accounting for about 17% of the country's exports in 2017 and earning the country US$545 million. Exports of apparel, hides, skins, vanilla, vegetables, fruits, cut flowers, and fish are growing, while cotton, tea, and tobacco continue to be mainstays.

Uganda produced in 2018:

In addition, there are smaller productions of other agricultural products, like cotton (87 thousand tons), tea (62 thousand tons), tobacco (35 thousand tons) and cocoa (27 thousand tons).


Manufacturing

The Ugandan manufacturing sector is dominated by agro-processing, food and beverages, household products, construction materials and fast-moving consumer goods. Most firms are small and medium enterprises concentrated in Kampala and the Central Region. Most products manufactured in Uganda are aimed at domestic consumption, and exports are limited to the regional markets in East Africa, including Rwanda, Burundi, South Sudan, Democratic Republic of the Congo (DRC), and the regions of Kenya and Tanzania bordering Uganda.

Manufacturing was reported to account for 15.8% of GDP in 2020, according to the World Bank, employing about 6.622% of formal-sector labour.

Coffee pulping process
A steel works in Jinja
Annual production levels 2016–2020
Sector Weight 2016 2017 2018 2019 2020 Pct. change

2018–2019

Pct. change

2019–2020

Total manufacturing 1000 234.67 245.29 268.34 277.69 285.91 3.5 3
Food processing 400 211.57 204.14 264.04 251.64 239.79 -4.7 -4.7
Drinks and tobacco 210 282.89 313.34 324.91 363.34 346.13 11.8 -4.7
Textiles, clothing and footwear 43 153.37 166.97 170.48 204.08 252.78 19.7 23.9
Sawmilling, paper and printing 35 250.56 295.68 324.51 296.62 273.35 -8.6 -7.8
Chemicals, paint, soap and foam products 97 292.25 346.41 261.21 316.73 363.47 21.3 14.8
Bricks and cement 75 290.01 295.26 336.88 345.66 463.4 2.6 34.1
Metal products 83 162.94 168.53 154.13 149.5 162.78 -3 8.2
Miscellaneous 66 214.24 202.25 230.61 238.02 248.84 3.2 4.5
Uganda's industrial performance comparisons 2018 (World Bank)
Ethiopia Kenya Vietnam Uganda
Industry contribution to GDP (%) 27.3 16.4 34.2 19.9
Share of manufactured exports to

total exports (%)

13 28 83 23
Manufacturing value added (%) 5.8 7.7 16.0 8.3
Share of employment (%) 12 7.6 25.8 7.4

Transportation

As of 2017, Uganda had about 130,000 kilometres (80,778 mi) of roads, with approximately 5,300 kilometres (3,293 mi) (4 percent) paved. Most paved roads radiate from Kampala, the country's capital and largest city.

As of 2017, Uganda's metre gauge railway network measures about 1,250 kilometres (777 mi) in length. Of this, about 56% (700 kilometres (435 mi)), is operational. A railroad originating at Mombasa on the Indian Ocean connects with Tororo, where it branches westward to Jinja, Kampala, and Kasese and northward to Mbale, Soroti, Lira, Gulu, and Pakwach. The only railway line still operating, however, is the one to Kampala.

Uganda's important link to the port of Mombasa is now mainly by road, which serves its transport needs and also those of neighboring Rwanda, Burundi, parts of the Democratic Republic of the Congo, and South Sudan.

An international airport is at Entebbe on the northern shores of Lake Victoria, about 41 kilometres (25 mi) south of Kampala. In January 2018, the government of Uganda began the construction of Kabalega International Airport, in the Western Region of Uganda. This will be Uganda's second international airport, which is planned to facilitate the construction of an oil refinery and boost tourism.

The transport union Amalgamated Transport and General Workers Union (ATWGU) is one of the more powerful trade unions in the country with about 100,000 members, many of whom are informal workers.

Communications

The Uganda Communications Commission regulates communications, primarily "delivered through an enabled private sector." The companies it regulates include television networks, radio stations, mobile network operators, and fixed-line telephone companies.

Mining and petroleum

Uganda's predominant mineral occurrences are gold, tungsten, tin, beryl, and tantalite in the south; tungsten, clay, and granite between latitude zero and two degrees north; and gold, mica, copper, limestone, and iron in the north.

In late 2012, the government of Uganda was taken to court over value added tax that it placed on goods and services purchased by Tullow Oil, a foreign oil company operating in the country at the time. The court case was heard at an international court based in the United States. The Ugandan government insisted that Tullow could not claim taxes on supplies as recoverable costs before oil production starts. Sources from within the government reveal that the main concern at present is the manner in which millions of dollars have been lost in the past decade, money that could allegedly have stayed in Uganda for investment in the public sector; a Global Financial Integrity report recently revealed that illicit money flows from Uganda between 2001 and 2012 totalled $680 million. Tullow Oil was represented in the court case by Kampala Associated Advocates, whose founder is Elly Kurahanga, the President of Tullow Uganda. A partner at Kampala Associated Advocates, Peter Kabatsi, was also Uganda's solicitor general between 1990 and 2002, and he has denied claims that he negotiated contracts with foreign oil firms during his time in this role.

In June 2015, the Ugandan government and Tullow Oil settled a longstanding dispute regarding the amount of certain capital gains taxes that the company owed to the government. The government claimed that the company owed US$435 million. The claim, however, was settled for US$250 million.

In April 2018, the government signed agreements with Albertine Graben Refinery Consortium, an International consortium led by General Electric of the United States, to build a 60,000 barrels-per-day Uganda Oil Refinery in Western Uganda. The cost of the development is budgeted at about US$4 billion.

International trade and finance

Treemap of product exports from Uganda in 2019.Gold (precious metals) — 56.98% — US$ 1,714,239,856Coffee (vegetable products) — 12.69% — US$ 381,675,559Milk (animal products) — 3.08% — US$ 92,529,809Fish fillets (animal products) — 3.00% — US$ 90,309,163Raw tobacco (foodstuffs) — 2.15% — US$ 64,693,330Cocoa beans (foodstuffs) — 2.13% — US$ 63,939,292Processed fish (animal products) — 2.03% — US$ 61,127,949Other live plants (vegetable products) — 1.23% — US$ 36,875,606Other oily seeds (vegetable products) — 1.21% — US$ 36,354,742Raw cotton (textiles) — 1.10% — US$ 33,066,298Concentrated milk (animal products) — 1.07% — US$ 32,135,516Vanilla (vegetable products) — 1.00% — US$ 30,152,295Cut flowers (vegetable products) — 0.80% — US$ 23,994,906Plywood (wood products) — 0.71% — US$ 21,460,830Packaged medicaments (chemical products) — 0.63% — US$ 19,087,796Tea (vegetable products) — 0.59% — US$ 17,790,968Non-fillet fresh fish (animal products) — 0.52% — US$ 15,729,883Electricity (mineral products) — 0.44% — US$ 13,250,577Seed oils (animal and vegetable bi-products) — 0.42% — US$ 12,520,943Wood fiberboard (wood products) — 0.37% — US$ 11,275,627Dried legumes (vegetable products) — 0.34% — US$ 10,117,416Other vegetables (vegetable products) — 0.30% — US$ 8,940,783Soybean meal (foodstuffs) — 0.27% — US$ 8,101,795Non-fillet frozen fish (animal products) — 0.24% — US$ 7,148,229Tropical fruits (vegetable products) — 0.22% — US$ 6,486,812Tanned equine and bovine hides (animal hides) — 0.21% — US$ 6,248,396Coated flat-rolled iron (metals) — 0.20% — US$ 6,133,106Raw sugar (foodstuffs) — 0.19% — US$ 5,630,244Iron wire (metals) — 0.18% — US$ 5,546,474Cement (mineral products) — 0.17% — US$ 5,209,483Fake hair (footwear and headwear) — 0.17% — US$ 4,973,565Bananas (vegetable products) — 0.16% — US$ 4,855,341Bran (foodstuffs) — 0.16% — US$ 4,738,577Cassava (vegetable products) — 0.16% — US$ 4,699,371Gelatin (chemical products) — 0.15% — US$ 4,429,926Butter (animal products) — 0.14% — US$ 4,280,751Plastic lids (plastics and rubbers) — 0.13% — US$ 3,869,407Tanned goat hides (animal hides) — 0.13% — US$ 3,867,759Corn (vegetable products) — 0.13% — US$ 3,815,386Rough wood (wood products) — 0.12% — US$ 3,741,407Paper containers (paper goods) — 0.12% — US$ 3,569,673Hair products (chemical products) — 0.11% — US$ 3,273,235Prepared cotton (textiles) — 0.10% — US$ 3,145,304Tanned sheep hides (animal hides) — 0.10% — US$ 3,094,645Casein (chemical products) — 0.10% — US$ 3,069,154Non-iron and steel slag, ash and residues (mineral products) — 0.10% — US$ 2,969,149Planes, helicopters, and/or spacecraft (transportation) — 0.10% — US$ 2,861,308Beauty products (chemical products) — 0.09% — US$ 2,688,158Soap (chemical products) — 0.08% — US$ 2,523,373Alcohol > 80% abv (foodstuffs) — 0.08% — US$ 2,487,014Knit t-shirts (textiles) — 0.08% — US$ 2,305,625Other vegetable oils (animal and vegetable bi-products) — 0.08% — US$ 2,300,180Paintings (arts and antiques) — 0.08% — US$ 2,300,138Polyacetals (plastics and rubbers) — 0.08% — US$ 2,288,521Other small iron pipes (metals) — 0.07% — US$ 2,245,601Other mineral (mineral products) — 0.07% — US$ 2,055,272Iron nails (metals) — 0.07% — US$ 2,025,939Raw plastic sheeting (plastics and rubbers) — 0.06% — US$ 1,941,328Sawn wood (wood products) — 0.06% — US$ 1,928,703Tin ores (mineral products) — 0.06% — US$ 1,872,049Rubber tires (plastics and rubbers) — 0.06% — US$ 1,839,508Cereal flours (vegetable products) — 0.06% — US$ 1,826,493Unglazed ceramics (stone and glass) — 0.06% — US$ 1,685,286Ground nuts (vegetable products) — 0.05% — US$ 1,358,337Insect resins (vegetable products) — 0.04% — US$ 1,310,285Basketwork (wood products) — 0.04% — US$ 1,196,762Processed tobacco (foodstuffs) — 0.04% — US$ 1,195,095Tungsten ore (mineral products) — 0.04% — US$ 1,166,406Rubber footwear (footwear and headwear) — 0.04% — US$ 1,118,375Other uncoated paper (paper goods) — 0.04% — US$ 1,111,063Raw iron bars (metals) — 0.04% — US$ 1,100,048Aluminium bars (metals) — 0.03% — US$ 1,010,473Perfume plants (vegetable products) — 0.03% — US$ 992,297Broadcasting equipment (machines) — 0.03% — US$ 984,225Rubber inner tubes (plastics and rubbers) — 0.03% — US$ 943,799Awnings, tents, and sails (textiles) — 0.03% — US$ 871,601Essential oils (chemical products) — 0.03% — US$ 833,010Stearic acid (animal and vegetable bi-products) — 0.03% — US$ 813,389Poultry meat (animal products) — 0.03% — US$ 810,947Pepper (vegetable products) — 0.03% — US$ 809,308Other edible preparations (foodstuffs) — 0.03% — US$ 803,471Onions (vegetable products) — 0.03% — US$ 799,715Spices (vegetable products) — 0.03% — US$ 796,851Prepared explosives (chemical products) — 0.03% — US$ 790,193Baked goods (foodstuffs) — 0.03% — US$ 787,517Other pure vegetable oils (animal and vegetable bi-products) — 0.03% — US$ 776,378Aluminium housewares (metals) — 0.02% — US$ 747,625Prefabricated buildings (miscellaneous) — 0.02% — US$ 744,815Niobium, tantalum, vanadium and zirconium ore (mineral products) — 0.02% — US$ 716,665Aircraft parts (transportation) — 0.02% — US$ 698,765Other fruits (vegetable products) — 0.02% — US$ 683,581Packing bags (textiles) — 0.02% — US$ 674,010Nonaqueous paints (chemical products) — 0.02% — US$ 669,777Aluminium structures (metals) — 0.02% — US$ 662,434Medical instruments (instruments) — 0.02% — US$ 656,809Facial tissue (paper goods) — 0.02% — US$ 649,370Soybeans (vegetable products) — 0.02% — US$ 647,432Sorghum (vegetable products) — 0.02% — US$ 632,438Paper labels (paper goods) — 0.02% — US$ 608,673Sugar preserved foods (foodstuffs) — 0.02% — US$ 599,804Palm oil (animal and vegetable bi-products) — 0.02% — US$ 567,711Iron blocks (metals) — 0.02% — US$ 566,150Cleaning products (chemical products) — 0.02% — US$ 560,687Electrical transformers (machines) — 0.02% — US$ 529,104Paper notebooks (paper goods) — 0.02% — US$ 519,801Other processed fruits and nuts (foodstuffs) — 0.02% — US$ 502,442Other furniture (miscellaneous) — 0.02% — US$ 495,443Hard liquor (foodstuffs) — 0.02% — US$ 481,195Raw lead (metals) — 0.02% — US$ 461,214Plastic pipes (plastics and rubbers) — 0.01% — US$ 437,746Telephones (machines) — 0.01% — US$ 435,925Lifting machinery (machines) — 0.01% — US$ 419,106Aqueous paints (chemical products) — 0.01% — US$ 402,850Trunks and cases (animal hides) — 0.01% — US$ 388,398Locust beans, seaweed, sugar beet, cane, for food (vegetable products) — 0.01% — US$ 380,718Soybean oil (animal and vegetable bi-products) — 0.01% — US$ 380,429Computers (machines) — 0.01% — US$ 379,913Iron structures (metals) — 0.01% — US$ 373,471Wood crates (wood products) — 0.01% — US$ 356,727Refined petroleum (mineral products) — 0.01% — US$ 352,976Heavy synthetic cotton fabrics (textiles) — 0.01% — US$ 343,385Petroleum jelly (mineral products) — 0.01% — US$ 336,940Detonating fuses (chemical products) — 0.01% — US$ 335,158Citrus (vegetable products) — 0.01% — US$ 326,447Other aluminium products (metals) — 0.01% — US$ 315,778Saturated acyclic monocarboxylic acids (chemical products) — 0.01% — US$ 313,375Other vegetable residues (foodstuffs) — 0.01% — US$ 309,033Dental products (chemical products) — 0.01% — US$ 302,115Values below 0.01% (machines) — 0.11% — US$ 3,325,606Values below 0.01% (textiles) — 0.08% — US$ 2,257,960Values below 0.01% (metals) — 0.07% — US$ 2,196,215Values below 0.01% (vegetable products) — 0.07% — US$ 2,091,077Values below 0.01% (chemical products) — 0.06% — US$ 1,847,404Values below 0.01% (plastics and rubbers) — 0.06% — US$ 1,734,248Values below 0.01% (foodstuffs) — 0.04% — US$ 1,225,446Values below 0.01% (paper goods) — 0.04% — US$ 1,097,431Values below 0.01% (instruments) — 0.04% — US$ 1,089,419Values below 0.01% (animal products) — 0.03% — US$ 888,401Values below 0.01% (stone and glass) — 0.03% — US$ 883,271Values below 0.01% (miscellaneous) — 0.02% — US$ 650,754Values below 0.01% (transportation) — 0.01% — US$ 438,892Values below 0.01% (animal and vegetable bi-products) — 0.01% — US$ 300,510Values below 0.01% (mineral products) — 0.01% — US$ 295,438Values below 0.01% (footwear and headwear) — 0.01% — US$ 277,314Values below 0.01% (wood products) — 0.01% — US$ 211,560Values below 0.01% (animal hides) — 0.00% — US$ 114,714
Exports of Uganda by product category (2019)
  Chemical products
  Transportation
  Machines
  Mineral products
  Plastics and rubbers
  Metals
  Foodstuffs
  Precious metals
  Textiles
  Instruments
  Animal products
  Vegetable products
  Paper goods
  Footwear and headwear
  Miscellaneous
  Stone and glass
  Wood products
  Animal and vegetable bi-products
  Animal hides
  Arts and antiques
  Weapons
Ugandan export destinations in 2006

Since assuming power in early 1986, Museveni's government has taken important steps toward economic rehabilitation. The country's infrastructure, notably its transport and communications systems which were destroyed by war and neglect, is being rebuilt. Recognizing the need for increased external support, Uganda negotiated a policy framework paper with the IMF and the World Bank in 1987. Uganda subsequently began implementing economic policies designed to restore price stability and sustainable balance of payments, improve capacity utilization, rehabilitate infrastructure, restore producer incentives through proper price policies, and improve resource mobilization and allocation in the public sector. These so-called Structural Adjustment Programs greatly improved the shape of the Ugandan economy, but did not lead to economic growth in the first decade after their implementation. Since 1995, Uganda has experienced rapid economic growth, but it is not clear to what extent this positive development can be attributed to Structural Adjustment. Uganda has been a member of the World Trade Organization, since January 1st 1995 and a member of the General Agreement on Tariffs and Trade, since October 25th 1962.

Women in the economy

The informal economy, which is predominantly female, is broadly defined as a group of vulnerable individuals without protections in regards to their work. Women face a plethora of barriers specific to gender when attempting to access the formal economy of Uganda, and research revealed prejudice against lending to women in the informal sector. The agriculture sector of the Ugandan economy, which composes roughly 40% of the country's GDP, is largely fulfilled by women laborers, especially in managing products, marketing, and the crop sub-sector. 76% of women work in the agriculture sector and roughly 66% of men do, and women provide for 80% of food crops and 60% of traditional exports such as coffee or tea. In the formal, non-agricultural economy, men constitute 61% of the workforce, whereas women predominate the informal economy, and this can be attributed to the lack of equity between men and women in the country. The Uganda Bureau of Statistics reported, when looking at the urban workforce in 2015, 88.6% of women were employed informally, and 84.2% of men were. Women are unable to enter into certain sectors, especially in the formal economy, due to the inability to provide substantial initial funding, and remain in the trade and service sectors of the economy. Comparatively, men dominate the more profitable sectors, such as manufacturing. Women traders make up 70% of those in markets and 40% in shops in addition to dominating other sectors such as the service industry, crafts, and tailoring.

Women are often undervalued in data compilation, particularly when considering their role in their domestic home lives. For example, women commonly match the contribution of their husbands to their familial income, if not provide more, when taking into consideration the value of their labor and the profits made from selling excess food. Urban women on average earn between 50% and 70% of a household's income. Women are also discredited in data collection due to biases of data collectors resulting in inaccurate reports, as well as income being measured per house, rather than separating by gender. The barriers women face in furthering their entrepreneurial careers are different from those faced by men; this is inherent in the biased culture and institutions plaguing Uganda despite the passing of somewhat progressive policies, especially with the 1985 transition of government to the National Resistance Movement party.

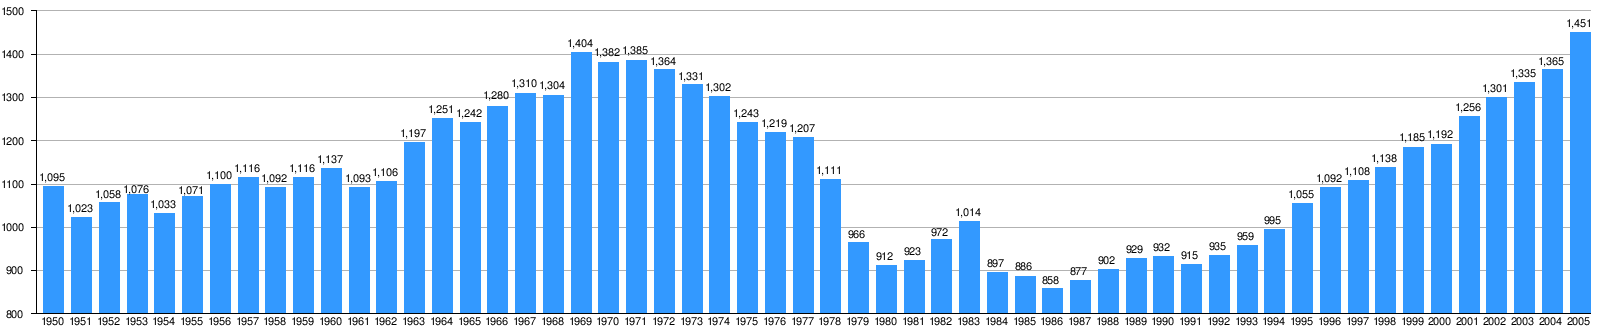
GDP per capita

GDP per capita (PPP) according to Madisson

Historical evolution of GDP per capita (PPP) of Uganda during the period 1950-2005 (expressed in dollars)

Source: Maddison Historical Statistics Project

Historical evolution of GDP per capita (PPP) of Uganda during the period 1985-2040 (expressed in dollars)

Source: Maddison Historical Statistics Project

A 2013 report estimated that malnutrition costs Uganda US$899 million each year, equivalent to about 5.6% of GDP.

Data

Year GDP

(in bil. US$ PPP)

GDP per capita

(in US$ PPP)

GDP

(in bil. US$ nominal)

GDP growth

(real)

Inflation rate

(in Percent)

Government debt

(in % of GDP)

1980 4.7 416 7.5 Decrease-3.4% Increase99.2% n/a
1981 Increase5.3 Increase459 Increase12.1 Increase3.9% Increase100.0% n/a
1982 Increase6.1 Increase512 Decrease8.4 Increase8.2% Increase100.0% n/a
1983 Increase6.7 Increase541 Increase9.6 Increase4.9% Increase150.0% n/a
1984 Increase6.7 Decrease527 Decrease7.4 Decrease-3.0% Increase16.7% n/a
1985 Increase6.7 Decrease510 Decrease6.8 Decrease-3.0% Increase100.0% n/a
1986 Increase6.9 Decrease507 Decrease6.7 Increase0.9% Increase143.8% n/a
1987 Increase7.4 Increase521 Increase10.9 Increase4.0% Increase215.4% n/a
1988 Increase8.3 Increase563 Increase11.3 Increase8.3% Increase166.7% n/a
1989 Increase9.1 Increase600 Decrease9.1 Increase6.4% Increase130.8% n/a
1990 Increase10.1 Increase639 Decrease7.5 Increase6.5% Increase45.4% n/a
1991 Increase10.6 Increase649 Decrease3.9 Increase1.8% Increase20.8% n/a
1992 Increase11.5 Increase681 Decrease3.6 Increase5.9% Increase42.2% n/a
1993 Increase12.6 Increase719 Increase4.3 Increase6.7% Increase30.0% n/a
1994 Increase13.8 Increase766 Increase6.2 Increase7.7% Increase5.8% n/a
1995 Increase15.4 Increase827 Increase7.5 Increase9.2% Increase6.8% n/a
1996 Increase16.7 Increase869 Increase7.7 Increase6.6% Increase7.5% n/a
1997 Increase17.8 Increase896 Increase8.4 Increase4.6% Increase7.7% 44.2%
1998 Increase19.1 Increase932 Decrease8.2 Increase6.1% Increase5.8% Negative increase45.1%
1999 Increase20.9 Increase989 Decrease7.8 Increase8.0% Increase5.8% Negative increase47.7%
2000 Increase22.2 Increase1,017 Decrease7.8 Increase3.9% Increase3.4% Negative increase48.5%
2001 Increase24.7 Increase1,095 Increase7.8 Increase8.8% Increase1.9% Negative increase51.4%
2002 Increase26.8 Increase1,153 Increase8.4 Increase7.1% Decrease-0.3% Negative increase54.7%
2003 Increase29.0 Increase1,204 Increase8.7 Increase6.2% Increase8.7% Negative increase55.1%
2004 Increase31.6 Increase1,264 Increase10.8 Increase5.8% Increase3.7% Positive decrease49.0%
2005 Increase35.8 Increase1,388 Increase12.5 Increase10.0% Increase8.6% Positive decrease42.6%
2006 Increase39.5 Increase1,481 Increase14.1 Increase7.0% Increase7.2% Positive decrease27.8%
2007 Increase43.8 Increase1,588 Increase17.5 Increase8.1% Increase6.1% Positive decrease17.0%
2008 Increase49.4 Increase1,727 Increase22.4 Increase10.4% Increase12.0% Positive decrease15.7%
2009 Increase53.7 Increase1,816 Increase24.1 Increase8.1% Increase13.0% Positive decrease14.8%
2010 Increase58.4 Increase1,913 Increase24.7 Increase7.5% Increase4.0% Negative increase18.4%
2011 Increase64.2 Increase2,034 Increase27.5 Increase7.7% Increase18.7% Positive decrease18.0%
2012 Increase66.9 Increase2,055 Increase30.9 Increase2.3% Increase14.0% Negative increase19.5%
2013 Increase70.7 Increase2,110 Increase32.3 Increase3.9% Increase5.5% Negative increase22.1%
2014 Increase76.1 Increase2,206 Increase34.8 Increase5.7% Increase4.3% Negative increase24.8%
2015 Increase82.9 Increase2,336 Decrease30.1 Increase8.0% Increase3.7% Negative increase28.0%
2016 Increase83.8 Decrease2,293 Increase30.2 Increase0.2% Increase5.2% Negative increase31.3%
2017 Increase91.1 Increase2,419 Increase31.6 Increase6.8% Increase5.6% Negative increase33.6%
2018 Increase101.3 Increase2,608 Increase34.1 Increase5.6% Increase2.5% Negative increase35.0%
2019 Increase111.3 Increase2,796 Increase37.9 Increase7.6% Increase2.1% Negative increase38.0%
2020 Increase113.8 Decrease2,760 Decrease37.9 Decrease-1.2% Increase2.8% Negative increase46.8%
2021 Increase127.6 Increase3,006 Increase42.8 Increase5.5% Increase2.2% Negative increase50.3%
2022 Increase145.1 Increase3,314 Increase47.3 Increase6.2% Increase7.2% Positive decrease49.9%
2023 Increase158.0 Increase3,495 Increase52.0 Increase5.0% Increase5.4% Negative increase50.4%
2024 Increase171.7 Increase3,682 Increase57.1 Increase6.0% Increase3.3% Negative increase51.8%
2025 Increase188.4 Increase3,924 Increase66.0 Increase6.7% Increase3.6% Negative increase54.2%
2026 Increase208.4 Increase4,192 Increase73.4 Increase7.5% Increase4.0% Negative increase55.0%

Source: IMF Figures for 2025 include IMF estimates; figures for 2026 are IMF projections (April 2026).

See also

References

  1. ↑ "World Economic Outlook Database, April 2019". IMF.org. International Monetary Fund. Retrieved 29 September 2019.
  2. ↑ "World Bank Country and Lending Groups". datahelpdesk.worldbank.org. World Bank. Retrieved 29 September 2019.
  3. 1 2 3 4 5 6 "IMF DataMapper: Uganda". International Monetary Fund. 2025. Retrieved 16 June 2025.
  4. ↑ "GDP per capita growth (annual %), World Bank Group, accessed June 2026".
  5. ↑ "World Economic Outlook Database, October 2019". IMF.org. International Monetary Fund. Retrieved 27 February 2020.
  6. ↑ Biryabarema, Elias (3 October 2017). "Uganda central bank lowers key lending rate to 9.5 percent". Reuters.com. Retrieved 8 June 2018.
  7. 1 2 3 4 5 6 7 8 9 10 11 12 13 "AFRICA :: UGANDA". CIA.gov. Central Intelligence Agency. Archived from the original on January 9, 2021. Retrieved 29 January 2020.
  8. ↑ "Poverty headcount ratio at $1.90 a day (2011 PPP) (% of population) - Uganda". data.worldbank.org. World Bank. Retrieved 29 January 2020.
  9. ↑ "GINI index (World Bank estimate) - Uganda". data.worldbank.org. World Bank. Retrieved 29 January 2020.
  10. ↑ "Human Development Index (HDI)". hdr.undp.org. HDRO (Human Development Report Office) United Nations Development Programme. Retrieved 22 November 2022.
  11. ↑ "Inequality-adjusted Human Development Index (IHDI)". hdr.undp.org. HDRO (Human Development Report Office) United Nations Development Programme. Retrieved 22 November 2022.
  12. ↑ "Labor force, total - Uganda". data.worldbank.org. World Bank. Retrieved 29 January 2020.
  13. ↑ "Employment to population ratio, 15+, total (%) (national estimate) - Uganda". data.worldbank.org. World Bank. Retrieved 29 January 2020.
  14. ↑ "ILOSTAT Country profiles". International Labour Organization. 2025. Retrieved 2026-06-25.
  15. ↑ UNCTAD (November 2017). "Uganda: Foreign Investment: Foreign Direct Investment". Export Entreprises SA Quoting UNCTAD. Archived from the original on 12 June 2018. Retrieved 8 June 2018.
  16. ↑ "Audit report: Public debt growing at higher rate than GDP". The Independent (Uganda). 10 January 2024. Retrieved 20 May 2024.
  17. 1 2 3 KPMG (June 2017). "Uganda Budget Brief 2017: Economic Commentary" (PDF). Nairobi: KPMG Kenya. Retrieved 8 June 2018.
  18. ↑ "S&P lowers Uganda sovereign credit rating to B from B+". Reuters. 17 January 2014. Retrieved 9 December 2014.
  19. 1 2 "Uganda | World Bank Group". www.worldbank.org. Retrieved 2026-05-24.
  20. ↑ "Invest in Uganda: A Guide to Africa's Investment Pearl". www.mktimothy.com. Retrieved 2025-06-20.
  21. ↑ Yapp, Helen (2018-05-02). "Uganda: A home to almost 50 percent of East Africa's arable land". Futurepump. Retrieved 2026-05-24.
  22. ↑ Staff Writer (31 May 2016). "The richest and poorest countries in Africa". Johannesburg: Businesstech.co.za. Retrieved 8 June 2018.
  23. ↑ John Aglionby (27 April 2017). "Uganda's oil reserves bring promise of work and infrastructure". The Financial Times. London. Archived from the original on 2022-12-10. Retrieved 8 June 2018.
  24. ↑ CARE International (13 November 2002). "Economic cost of the conflict in Northern Uganda". New York City: ReliefWeb. Retrieved 8 June 2018.
  25. 1 2 3 World Bank. "World Development Indicators". Washington, DC: World Bank Group. Retrieved 3 June 2018.
  26. ↑ Bank of Uganda (8 June 2018). "History of Uganda Currency". Kampala: Bank of Uganda. Archived from the original on 12 June 2018. Retrieved 8 June 2018.
  27. 1 2 Nakaweesi, Dorothy (25 October 2017). "Uganda posts highest coffee export volumes at 4.6 million bags". Daily Monitor. Kampala. Retrieved 8 June 2018.
  28. ↑ International Trade Administration (8 March 2017). "Uganda - Agriculture". Washington, DC: United States Department of Commerce. Retrieved 8 June 2018.
  29. ↑ Uganda production in 2018, by FAO
  30. 1 2 Linda Calabrese, Frederick Golooba-Mutebi, Maximiliano Mendez-Parra (December 2019). "INDUSTRIAL DEVELOPMENT IN UGANDA "An assessment of the policy framework"" (PDF). Archived (PDF) from the original on 21 June 2021. Retrieved 18 April 2022. {{cite journal}}: Cite journal requires |journal= (help)
  31. 1 2 Uganda Investment Authority (2022-01-26). "Uganda's industrial journey so far: progress, achievements, and prospects". Uganda Investment Authority. Archived from the original on 29 January 2022. Retrieved 2022-04-18.
  32. 1 2 Ministry of Works & Transport (2017). "Key Summary Statistics". Kampala: Uganda Ministry of Works and Transport. Archived from the original on 30 July 2020. Retrieved 8 June 2018.
  33. ↑ "Map of Uganda Showing Main Roads". Dlca.logcluster.org. 2017. Archived from the original on 20 January 2021. Retrieved 8 June 2018.
  34. ↑ NCTTCA (2018). "About the Northern Transportation Corridor". Mombasa: Northern Corridor Transit and Transportation Coordination Authority (NCTTCA). Archived from the original on 3 February 2018. Retrieved 8 June 2018.
  35. ↑ Globefeed.com (8 June 2018). "Distance between Post Office Building, Kampala Road, Kampala, Uganda and Entebbe International Airport, 5536 Kampala Road, Entebbe, Uganda". Globefeed.com. Retrieved 8 June 2018.
  36. ↑ Steenhoff-Snethlage, Erin (11 December 2017). "Second international airport on the way for Uganda". Johannesburg: Ftwonline.co.za. Retrieved 8 June 2018.
  37. ↑ Schminke, Tobias Gerhard (2019). Labour-centred development and decent work : a structuralist perspective on informal employment and trade union organizing in Uganda. Halifax, Nova Scotia: Saint Mary's University. Retrieved 28 August 2023.
  38. ↑ Paul Mugume (23 January 2017). "Uganda Communications Commission Toughens on Local Content Prioritization". Kampala: TCTech Magazine. Retrieved 8 June 2018.
  39. ↑ Butagira, Tabu (31 August 2012). "Study shows Uganda's vast mineral riches". Daily Monitor. Kampala. Retrieved 8 June 2018.
  40. 1 2 3 Butagira, Tabu (17 December 2012). "Tullow sues government in new tax dispute". Daily Monitor. Kampala. Retrieved 8 June 2018.
  41. 1 2 NorthSouthNews (8 January 2013). "Tullow Oil and Ugandan government in second tax row". NorthSouthNews.com. Retrieved 8 June 2018.
  42. 1 2 RTÉ Ireland (22 June 2015). "Tullow pays $250 million to settle Uganda tax dispute out of court". RTÉ.ie. Dublin, Ireland: Raidió Teilifís Éireann. Retrieved 8 June 2018.
  43. ↑ Mason, Rowena (18 April 2011). "Tullow Oil sues Heritage over unpaid Ugandan tax bill". The Daily Telegraph. London. Retrieved 8 June 2018.
  44. ↑ Olingo, Allan (14 April 2018). "Uganda signs $4 billion refinery plant deal". The EastAfrican. Nairobi. Retrieved 8 June 2018.
  45. ↑ Musisi, Frederic (8 May 2018). "Uganda signs off Shs4 trillion for US in refinery". Daily Monitor. Kampala. Retrieved 8 May 2018.
  46. ↑ Baten, Jörg (2016). A History of the Global Economy. From 1500 to the Present. Cambridge University Press. pp. 332–334. ISBN 9781107507180.
  47. ↑ WTO (8 June 2018). "Uganda and the WTO". Geneva: World Trade Organization (WTO). Retrieved 8 June 2018.
  48. ↑ "Decent work and the informal economy - ILO 2002 | capacity4dev.eu". europa.eu. Retrieved 2019-05-13.
  49. 1 2 3 4 5 Snyder, Margarget (2000). Women in African Economies: From Burning Sun to Boardroom. Kampala: Fountain Publishers Ltd. pp. 5–6. ISBN 9970-02-187-7.
  50. ↑ Okurut, F. N.; Schoombee, A.; Berg, S. Van Der (2005). "Credit Demand and Credit Rationing in the Informal Financial Sector in Uganda1". South African Journal of Economics. 73 (3): 482–497. doi:10.1111/j.1813-6982.2005.00033.x. hdl:10019.1/50308. ISSN 1813-6982.
  51. 1 2 Ellis, Amanda; Manuel, Claire; Blackden, C. Mark (2006). Gender and Economic Growth in Uganda: Unleashing the Power of Women. Washington D.C.: The World Bank. pp. 27–37. ISBN 0-8213-6384-0.
  52. ↑ "2017 Statistical Report" (PDF). Uganda Bureau of Statistics: 169. 2017.
  53. 1 2 Lange, Siri (2003). "When women grow wings: Gender relations in the informal economy of Kampala". CMI Report. R 2003: 8: 1–8.
  54. ↑ Guma, Prince Karakire (7 September 2015). "Business in the urban informal economy: barriers to women's entrepreneurship in Uganda". Journal of African Business. 16 (3): 305–321. doi:10.1080/15228916.2015.1081025. S2CID 216149652.
  55. 1 2 Our World in Data (1950–1981). "Historical evolution of GDP per capita (PPP) of Uganda during the period 1950-2005". ourworldindata.org. Retrieved 2023-11-03.
  56. ↑ "Uganda's Cost of Hunger Study Findings Unveil The Economic Impact of Malnutrition". Scaling Up Nutrition. 2013-06-20. Retrieved 2026-06-06.
  57. ↑ "World Economic Outlook (April 2026) – Uganda". IMF Data Mapper. International Monetary Fund. Retrieved 2026-10-04.