Temperature–entropy diagram
| Thermodynamics |
|---|
 |


In thermodynamics, a temperature–entropy (T–s) diagram is a thermodynamic diagram used to visualize changes to temperature (T ) and specific entropy (s) during a thermodynamic process or cycle as the graph of a curve. It is a useful and common tool, particularly because it helps to visualize the heat transfer during a process. For reversible (ideal) processes, the area under the T–s curve of a process is the heat transferred to the system during that process.
Working fluids are often categorized on the basis of the shape of their T–s diagram.
An isentropic process is depicted as a vertical line on a T–s diagram, whereas an isothermal process is a horizontal line.

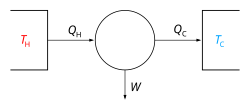
For reversible processes, such as those found in the Carnot cycle:
QC = the amount of energy exchanged between the system and the cold reservoir
QH = W + QC = heat exchanged with the hot reservoir. η = W / (QC + QH) = thermal efficiency of the cycleIf the cycle moves in a clockwise sense, then it is a heat engine that outputs work; if the cycle moves in a counterclockwise sense, it is a heat pump that takes in work and moves heat QH from the cold reservoir to the hot reservoir.

See also
- Carnot cycle
- Pressure–volume diagram
- Rankine cycle
- Saturation vapor curve
- Working fluid
- Working fluid selection