Tropical cyclones in 2000

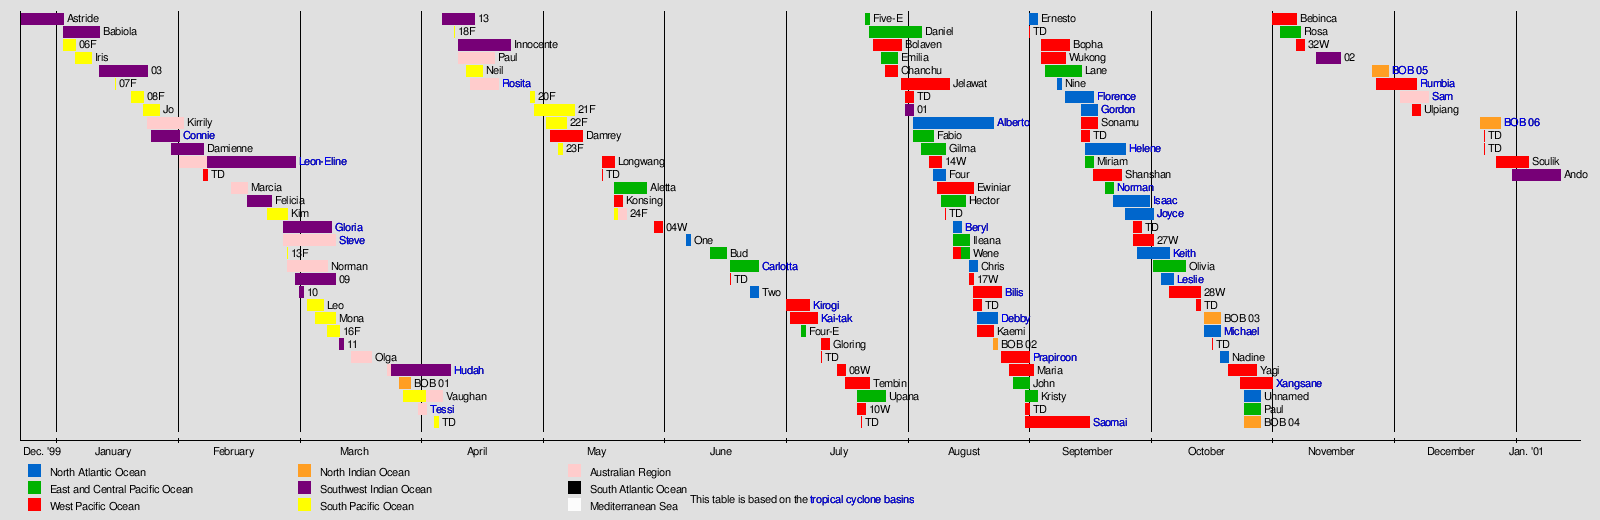
During 2000, 140 tropical or subtropical cyclones formed throughout the world. The cyclones originated in seven different areas called basins, where respective weather agencies named 81 storms when they attained maximum sustained winds of 65 km/h (40 mph). The strongest storm of the year was Cyclone Hudah in the south-west Indian Ocean, which attained a minimum pressure of 905 hPa (26.72 inHg), and 10-minute maximum sustained winds of 220 km/h (135 mph). Cyclone Paul tied Hudah's peak winds in the Australian basin.
The cyclones in 2000 produced significant impacts in parts of Africa, Asia, Oceania, and North America. In the western Pacific Ocean, floods produced by Typhoon Kai-tak and a nearby tropical depression led to the Payatas landslide that killed 218 people. In southeastern Africa, Cyclone Eline struck Madagascar and Mozambique after a period of above-normal rainfall, and the ensuing floods killed at least 700 people. The costliest storm was Saomai, which caused $6.3 billion in damage. The accumulated cyclone energy (ACE) index for the year 2000 (seven basins combined), as calculated by Colorado State University was 677.3 units.
There was an above-average number of storms during the year; the most active basin of the year was the Western Pacific, where a below-average 23 named storms formed. The Eastern Pacific and the North Atlantic were both relatively above-average, with 19 named storms forming in the Eastern Pacific and 15 in the North Atlantic. The Southern Hemisphere was also relatively average. Three Category 5 tropical cyclones were formed in 2000.
Global atmospheric and hydrological conditions
As the year began, a strong La Niña was peaking, with temperature anomalies going below −1.5 °C (−2.7 °F). NOAA's May hurricane outlook indicated that overall global conditions were conducive to increased activity in the North Atlantic basin. The La Niña began to weaken towards the latter part of 2000, with signs of weakening occurring as early as May. Astride crossed over from the previous year, dissipating on January 3.
Summary
North Atlantic Ocean

An average Atlantic hurricane season features 12 tropical storms, 6 hurricanes, and 3 major hurricanes, and features an Accumulated Cyclone Energy (ACE) count of 106. In 2000 in the North Atlantic basin, there were above-average numbers of named storms and hurricanes and an average number of major hurricanes. 2000 had an ACE count of 119, slightly higher than the average.
The season began with tropical depressions One and Two, both of which formed in June and affected no landmasses. Hurricane Alberto was the first named system of the 2000 season, intensifying into and peaking as a Category 3 hurricane. Alberto was the longest-lived storm of the 2000 Atlantic hurricane season. Four formed east of Florida, though it was not able to strengthen further and dissipated on August 11. Tropical Storm Beryl, Tropical Storm Chris, and Hurricane Debby all formed within a week of each other, with Beryl causing minimal damages in Mexico and Debby causing flooding throughout the Antilles. Tropical Storm Ernesto formed in the Main Development Region (MDR) and affected no landmasses, with Nine forming a week later in the Gulf of Mexico and making landfall on Sabine Pass. Hurricane Florence formed on September 10 and caused rip currents throughout the East Coast of the United States. Hurricane Gordon and Tropical Storm Helene formed on September 14 and 15 respectively, with both storms affecting the Gulf Coast and the East Coast. Hurricane Isaac was the second major hurricane of the season, peaking as a Category 4 hurricane and staying out to sea for most of its life. Hurricane Joyce peaked as a high-end Category 1 hurricane, with damage being limited to the Lesser Antilles. Hurricane Keith was the strongest storm of the season, forming on September 28. Keith rapidly intensified offshore of Belize, peaking as a Category 4 hurricane before weakening and making landfall. Keith caused $319 million in damage and caused 68 fatalities. Tropical Storm Leslie was a relatively weak and short-lived system, though its precursor caused $950 million in damages. Hurricane Michael formed on October 15 and transitioned to an extratropical cyclone just before making landfall in Newfoundland, causing moderate damage in the areas it affected. Tropical Storm Nadine formed days later, affecting no landmasses. The final system, an unnamed subtropical storm, formed on October 25 and affected New England and Atlantic Canada.
The season was not very destructive, causing a total of $1.296 billion in damage, most of which can be attributed to Hurricane Keith and Tropical Storm Leslie. Additionally, 105 people were killed, of which nearly two-thirds can be attributed to Hurricane Keith. The main reason for the lack of damage can be attributed to the lack of landfalling storms and the minimal impact from most of the storms that made landfall.
Eastern & Central Pacific Ocean

An average Pacific hurricane season features 15 tropical storms, 9 hurricanes, and 4 major hurricanes, and features an Accumulated Cyclone Energy (ACE) count of 132. In 2000, there were a below-average number of hurricanes and major hurricanes, though there was an above-average number of named storms. As a whole, the season was below-average, having a total of 95 ACE and featuring 19 tropical storms, 6 hurricanes, and 2 major hurricanes. A majority of the storms were weak and short-lived.
The first storm, Hurricane Aletta, formed on May 22 and peaked as a Category 2 hurricane. Tropical Storm Bud was a relatively weak tropical storm, affecting portions of Mexico. Hurricane Carlotta was the strongest storm of the month, peaking as a high-end Category 4 hurricane. Carlotta caused 18 fatalities after sinking a Lithuanian freighter. Following Carlotta, Four-E, Tropical Storm Upana, and Five-E formed in July, all 3 of which were weak and short-lived.
Systems
January

10 storms formed in the month of January, of which 6 were named by their respective agencies. Babiola was the first storm of the season, intensifying into one of the 4 storms that attained hurricane-force winds. Iris was an unusually small tropical cyclone, weakening while passing through Vanuatu. Connie was the strongest storm of the month, becoming an intense tropical cyclone and causing 3 fatalities.
February


February saw the formation of 10 systems, of which 7 were named. Leon–Eline, the first storm of the month, was the longest-lasting Indian Ocean tropical cyclone, causing significant damages in Madagascar and much of Southern Africa. Leon–Eline was tied for strongest storm of the month with Cyclone Norman. Gloria made landfall on Madagascar weeks after Leon–Eline made landfall, contributing to the early 2000 Madagascar floods. Steve traversed the northern and western coasts of Australia, making 4 landfalls in the process.
March

April

10 systems formed in the month of April, of which 5 were named. The first storm of the month, Cyclone Tessi, made landfall on Australia as a Category 3 severe tropical cyclone on the Australian scale. Innocente was a long-lasting yet weak storm, with its remnants causing heavy rains on Mauritius. Cyclone Paul was the strongest storm of the month, peaking with a minimum central pressure of 915 hPa. Cyclone Rosita was a small yet powerful tropical cyclone, peaking with 10-min winds of 205 km/h (125 mph) and making landfall at peak intensity.
May

June

June tied with November for least active month of 2000. 5 storms developed, of which 2 developed gale-force winds and were named by their respective agencies. Tropical Storm Bud was the first named storm, affecting Western Mexico. Hurricane Carlotta was the strongest storm of the month, becoming a high-end Category 4 hurricane. Carlotta caused the deaths of 18 people after sinking the M/V Linkuva.
July


August

August was a very active month, featuring 24 systems, 16 of which were named by their respective agencies.
September


October

November

The month of November saw 5 systems form, tying with June for the least active month. 3 systems attained gale-force winds, though only 2 were given names by their respective agencies. Rosa was the first storm of the month, forming on November 3 and peaking as a tropical storm. 2 more systems formed before BOB 05, also known as the 2000 South India cyclone, formed in the Bay of Bengal. The cyclone peaked as an extremely severe cyclonic storm, making it the strongest storm of the month before weakening at landfall. The last storm of the month, Rumbia, affected the Philippines and Vietnam, causing 48 fatalities.
December


The month of December saw 7 systems form, with 4 of the storms being named by their respective agencies. The month began with Cyclone Sam, which intensified into a Category 5 severe tropical cyclone on the Australian scale, making landfall on Western Australia at peak intensity. Ulpiang was a short-lived storm that caused flooding and deaths in the Philippines. BOB 06, also known as the 2000 Sri Lanka cyclone was the strongest storm to hit Sri Lanka since 1978, being attributed to 9 deaths. 2 tropical depressions formed in the West Pacific before Soulik formed and rapidly intensified into a moderately strong typhoon. The year finished with Cyclone Ando, peaking offshore as an intense tropical cyclone.
Global effects
See also
Notes
2 Only systems that formed either on or after January 1, 2000 are counted in the seasonal totals.
3 Only systems that formed either before or on December 31, 2000 are counted in the seasonal totals.
4 The wind speeds for this tropical cyclone/basin are based on the IMD Scale which uses 3-minute sustained winds.
5 The wind speeds for this tropical cyclone/basin are based on the Saffir Simpson Scale which uses 1-minute sustained winds.
6 The wind speeds for this tropical cyclone are based on Météo-France which uses wind gusts.
References
External links
| Tropical cyclone year articles (2000–2009) |
|---|
| 2000, 2001, 2002, 2003, 2004, 2005, 2006, 2007, 2008, 2009 |
Regional Specialized Meteorological Centers
- US National Hurricane Center – North Atlantic, Eastern Pacific
- Central Pacific Hurricane Center – Central Pacific
- Japan Meteorological Agency – NW Pacific
- India Meteorological Department – Bay of Bengal and the Arabian Sea
- Météo-France – La Reunion – South Indian Ocean from 30°E to 90°E
- Fiji Meteorological Service – South Pacific west of 160°E, north of 25° S
Tropical Cyclone Warning Centers
- Meteorology, Climatology, and Geophysical Agency of Indonesia – South Indian Ocean from 90°E to 141°E, generally north of 10°S
- Australian Bureau of Meteorology (TCWC's Perth, Darwin & Brisbane) – South Indian Ocean & South Pacific Ocean from 90°E to 160°E, generally south of 10°S
- Papua New Guinea National Weather Service – South Pacific Ocean from 141°E to 160°E, generally north of 10°S
- Meteorological Service of New Zealand Limited – South Pacific west of 160°E, south of 25°S
![]() This article incorporates public domain material from websites or documents of the National Weather Service.
This article incorporates public domain material from websites or documents of the National Weather Service.