Wiggers diagram

A Wiggers diagram, named after its developer, Carl Wiggers, is a unique diagram that has been used in teaching cardiac physiology for more than a century. In the Wiggers diagram, the X-axis is used to plot time subdivided into the cardiac phases, while the Y-axis typically contains the following on a single grid:
- Blood pressure
- Aortic pressure
- Ventricular pressure
- Atrial pressure
- Ventricular volume
- Electrocardiogram
- Arterial flow (optional)
- Heart sounds (optional)
The Wiggers diagram clearly illustrates the coordinated variation of these values as the heart beats, assisting one in understanding the entire cardiac cycle.
Events
Note that during isovolumetric/isovolumic contraction and relaxation, all the heart valves are closed; at no time are all the heart valves open. *S3 and S4 heart sounds are associated with pathologies and are not routinely heard.
Additional images
 Ventricular systole
 Cardiac diastole
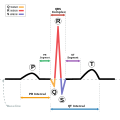 The EKG complex. P=P wave, PR=PR interval, QRS=QRS complex, QT=QT interval, ST=ST segment, T=T wave
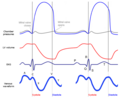 Wiggers with jugular venous waveform
![Wiggers diagram with mechanical (echo), electrical (ECG), and aortic pressure (catheter) waveforms, together with an in-ear dynamic pressure waveform measured using a novel infrasonic hemodynography technology, for a patient with severe aortic stenosis. Modified from [3]](https://upload.wikimedia.org/wikipedia/commons/thumb/f/f2/CathWiggers.png/120px-CathWiggers.png) Wiggers diagram with mechanical (echo), electrical (ECG), and aortic pressure (catheter) waveforms, together with an in-ear dynamic pressure waveform measured using a novel infrasonic hemodynography technology, for a patient with severe aortic stenosis. Modified from
Wiggers diagram with mechanical (echo), electrical (ECG), and aortic pressure (catheter) waveforms, together with an in-ear dynamic pressure waveform measured using a novel infrasonic hemodynography technology, for a patient with severe aortic stenosis. Modified from


![Wiggers diagram with mechanical (echo), electrical (ECG), and aortic pressure (catheter) waveforms, together with an in-ear dynamic pressure waveform measured using a novel infrasonic hemodynography technology, for a patient with severe aortic stenosis. Modified from [3]](https://en.wikipedia.org/wiki/File:CathWiggers.png)