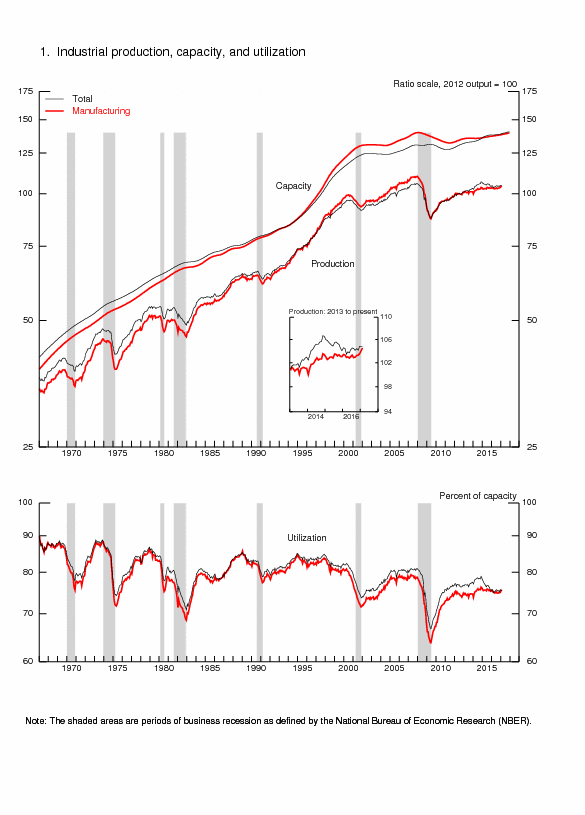
Capacity utilization or capacity utilisation is the extent to which a firm or nation employs its installed productive capacity (maximum output of a firm or nation). It is the relationship between output that is produced with the installed equipment, and the potential output which could be produced with it, if capacity was fully used. The metric is calculated by dividing the actual output by the full capacity over the same period, expressed as a percentage.
Engineering and economic measures
One of the most used definitions of the "capacity utilization rate" is the ratio of actual output to the potential output. But potential output can be defined in at least two different ways.
Engineering definition
One is the "engineering" or "technical" definition, according to which potential output represents the maximum amount of output that can be produced in the short run with the existing stock of capital. Thus, a standard definition of capacity utilization is the (weighted) average of the ratios between the actual output of firms and the maximum that could be produced per unit of time, with existing plant and equipment (see Johanson 1968). Output could be measured in physical units or in market values, but normally it is measured in market values.
However, as output increases and well before the absolute physical limit of production is reached, most firms might well experience an increase in the average cost of production—even if there is no change in the level of plant & equipment used. For example, higher average costs can arise because of the need to operate extra shifts, to undertake additional plant maintenance, and so on.
Economic definition
An alternative approach, sometimes called the "economic" utilization rate measures the ratio of actual output to the level of output beyond which the average cost of production begins to rise. In this case, surveyed firms are asked by how much it would be practicable for them to raise production from existing plant and equipment, without raising unit costs (see Berndt & Morrison 1981). Typically, this measure will yield a rate around 10 percentage points higher than the "engineering" measure, but time series show the same movement over time.
Alternatively, certain government definitions of capacity utilization defines maximum production attainable under normal operating conditions, rather than hypothetical continuous operation. These conditions reflect an establishment's usual operating practices, including the use of production facilities, work shifts, overtime, and holidays, rather than an absolute theoretical maximum output.
Measurement
Capacity utilization (black line) in manufacture in the United States, unemployment rate (red line, upside down, scale on the right), employment rate (dotted line)Capacity utilization in manufacturing in the FRG and in the USA
In economic statistics, capacity utilization is normally surveyed for goods-producing industries at the plant-level. The results are subsequently presented as an average percentage rate by industry and economy-wide, where 100% denotes full capacity. This rate is also sometimes called the "operating rate". If the operating rate is high, this is called "full capacity", while if the operating rate is low, a situation of "excess capacity" or "surplus capacity" exists. The observed rates are often turned into indices. Capacity utilization is much more difficult to measure for service industries.
There has been some debate among economists about the validity of statistical measures of capacity utilization, because much depends on the survey questions asked, and on the valuation principles used to measure output.[citation needed] Also, the efficiency of production may change over time, due to new technologies.
For example, Michael Perelman has argued in his 1989 book Keynes, Investment Theory and the Economic Slowdown: The Role of Replacement Investment and q-Ratios that the US Federal Reserve Board measure is just not very revealing. Prior to the early 1980s, he argues, American business carried a great deal of extra capacity. At that time, running close to 80% would indicate that a plant was approaching capacity restraints. Since that time, however, firms scrapped much of their most inefficient capacity. As a result, a modern 77% capacity utilization now would be equivalent to a historical level of 70%.
Economic significance
If market demand grows, capacity utilization will rise. If demand weakens, capacity utilization will slacken. Economists and bankers often watch capacity utilization indicators for signs of inflation pressures.
It is often believed that when the utilization rate rises above somewhere between 82% and 85%, price inflation will increase. Excess capacity means that insufficient demand exists to warrant expansion of output.
All else constant, the lower capacity utilization falls (relative to the trend capacity utilization rate), the better the bond market likes it. Bondholders view strong capacity utilization (above the trend rate) as a leading indicator of higher inflation. Higher inflation—or the expectation of higher inflation—decreases bond prices, often prompting a higher yield to compensate for the higher expected rate of inflation.
Capacity utilization and capitalist inefficiency
The capacity utilization rate is also an indicator of how efficiently the factors of production are being used. Much statistical and anecdotal evidence shows that many industries in the developed capitalist economies suffer from chronicexcess capacity. Critics of market capitalism, therefore, argue the system is not as efficient as it may seem, since at least 1/5 more output could be produced and sold, if buying power was better distributed. However, a level of utilization somewhat below the maximum typically prevails, regardless of economic conditions.
Scholars, have argued that declining capacity utilization in the United States provides evidence of increasing economic inefficiency under monopoly capitalism. They interpret the long-term downward trend of capacity utilization as indicating that limited opportunities for profitable investment discourage businesses from fully utilizing existing productive capacity. They further argue that underutilization contributes to economic stagnation, discourages further productive investment, and increases capitalism's dependence on financial activity rather than industrial production. In Monopoly Capital (1966), Paul A. Baran, and Paul Sweezy demonstrated that average utilization fell from ~85% during the 1920s to ~63% during the 1930s. Comparing the low utilization of the Great Depression with the subsequent expansion of industrial production during the Second World War, they argued that capitalist market constraints prevented the economy from realizing its productive potential. They further contend that conventional statistics on capacity utilization understate the extent of unused productive resources under capitalism.
Modern business cycle theory
The notion of capacity utilization was introduced into modern business cycle theory by Greenwood, Hercowitz, and Huffman (1988). They illustrated how capacity utilization is important for getting business cycle correlations in economic models to match the data when there are shocks to investment spending.
Output gap percentage formula
As a derivative indicator, the "output gap percentage" (%OG) can be measured as the gap between actual output (AO) and potential output (PO) divided by potential output and multiplied by 100%:
%OG = [(AO – PO)/PO] × 100%.
FRB and ISM utilization indexes
In the survey of plant capacity used by the US Federal Reserve Board for the FRB capacity utilization index, firms are asked about "the maximum level of production that this establishment could reasonably expect to attain under normal and realistic operating conditions, fully utilizing the machinery and equipment in place."
By contrast, the Institute for Supply Management (ISM) index asks respondents to measure their current output relative to "normal capacity", and this yields a utilization rate, which is between 4 and 10 percentage points higher than the FRB measure. Again, the time series show more or less the same historical movement.
In its August 2026 release, the Federal Reserve reported an average U.S. industrial capacity utilization rate of 79.4% for 1972–2025; its measure covers manufacturing, mining, and electric and gas utilities.
The average utilization rate of installed productive capacity in industry, in some major areas of the world, was estimated in 2003/2004 to be as follows (rounded figures):
E. Berndt & J. Morrison, "Capacity utilization measures: Underlying Economic Theory and an Alternative Approach", American Economic Review, 71, 1981, pp.48–52
I. Johanson, Production functions and the concept of capacity", Collection Economie et Mathematique et Econometrie, 2, 1968, pp.46–72
Michael Perelman, Keynes, Investment Theory and the Economic Slowdown
Susan Strange and Roger Tooze, The International Politics of Surplus Capacity: Competition for Market Shares in the World Recession (London: Allen & Unwin, 1981).
Jeremy Greenwood, Zvi Hercowitz, and Gregory W. Huffman, "Investment, Capacity Utilization and the Real Business Cycle," American Economic Review, 1988.
Thomas G. Rawski, "The Political Economy of China's Declining Growth", University of Pittsburgh.
Anwar Shaikh and Jamee Moudud, Measuring Capacity Utilization in OECD Countries: A Cointegration Method(2004), Working Paper No. 415, The Jerome Levy Economics Institute of Bard College.
Annys Shin, "Economy Strains Under Weight of Unsold Items", Washington Post, 17 February 2009, A01.